Everyone who files a complaint with NHTSA wonders the same thing: does this actually do anything? Put differently: how many complaints before a recall actually happens? We measured that question with public data.
Across the 11 popular vehicles in our study — every combination of vehicle and component system, 242 pairings in all — we counted the complaints filed about each system and checked whether that system was ever recalled. The relationship is strong, and it has a surprise at the top.
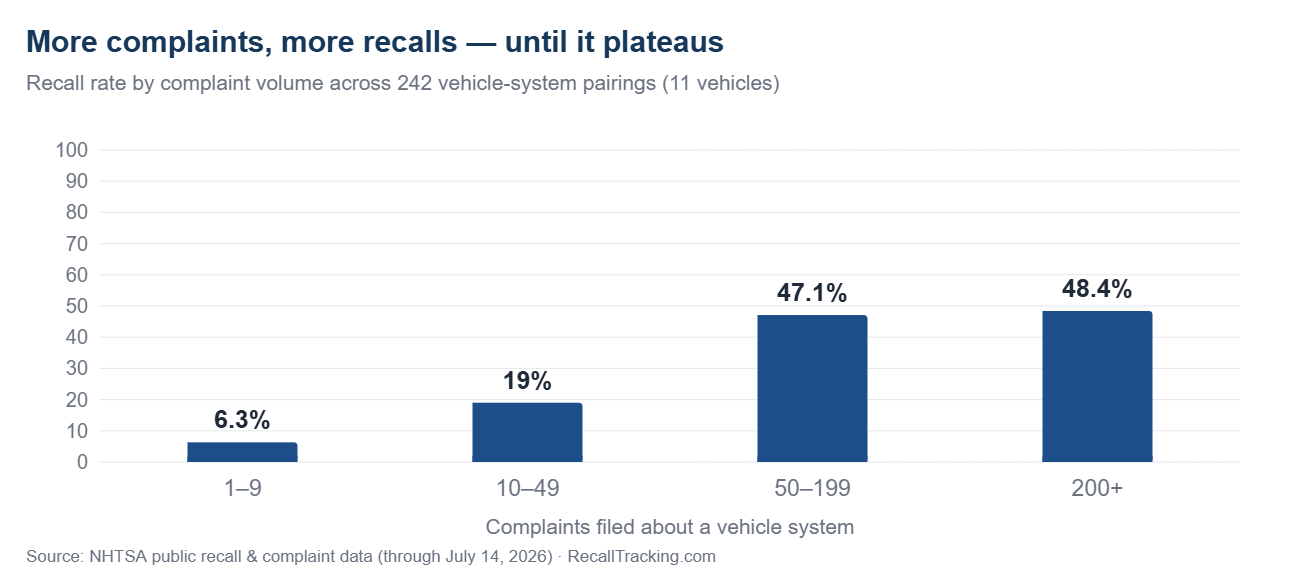
Complaints before a recall: the staircase
Vehicle systems that drew 1–9 complaints were recalled 6.3% of the time. At 10–49 complaints, the recall rate tripled to 19%. At 50–199, it reached 47.1%. Systems with 200 or more complaints: 48.4%. A system that crossed 50 complaints was about 7.5 times as likely to have been recalled as one with fewer than ten. Across all 242 pairings, the rank correlation between complaint volume and recall count is 0.38 — a strong association for data this noisy.
The plateau is the second story
Notice what happens after 50 complaints: nothing. The recall rate flattens near 48% and stays there — going from 50 complaints to 500 barely moves the odds. Whatever complaint volume signals to the recall system, the signal saturates. And that ceiling means something concrete: about half of the highest-complaint systems in our sample have never been recalled at all. We track all 14 of them — nearly 5,000 complaints’ worth — on our living recall watchlist.
Now, the honest part
Correlation is not causation, and this analysis cannot show that complaints cause recalls. The most important confounder is popularity: vehicles that sell in huge numbers accumulate both more complaints and more recalls, purely as a function of fleet size. Defect severity confounds in the other direction — a bad defect generates complaints and attracts a recall, without the complaints doing any causal work. What the data supports is the weaker, still useful claim: complaint volume strongly predicts recall likelihood. If you know how many complaints a vehicle system has drawn, you know a great deal about whether it has been — or plausibly will be — recalled.
Two smaller caveats. Our sample is 11 hand-picked popular vehicles from recall-heavy generations, not a random slice of the market; these rates describe this sample and likely sit higher than the fleet-wide truth. And complaints are self-reported and unverified — volume is a signal of owner-perceived problems, never proof of a defect.
What this means for you
Complaints are the public’s half of the recall system, and this data suggests the system listens — imperfectly, slowly, but measurably. Two practical takeaways. First, before buying a used vehicle, look at its complaint patterns, not just its open recalls: a system with a heavy complaint file sits in the ~48% territory where recalls happen about as often as not. You can search any vehicle in our vehicle recall lookup. Second, if your vehicle has a problem, file the complaint — we wrote a companion piece on how to file one that counts.
Complaints before a recall: quick answers
How many complaints does NHTSA need to issue a recall?
There is no set number. In our data, even systems with a handful of complaints were sometimes recalled (6.3%), and systems with hundreds sometimes never were. What rises with volume is the odds — up to roughly 48%.
Do complaints cause recalls?
Our analysis shows correlation, not causation: complaint volume predicts recall likelihood, but popularity and defect severity drive both. What is certain is that complaints are the public record regulators and manufacturers both see.
Where can I see the complaints before a recall for my own vehicle?
Every complaint is public. Search your vehicle at NHTSA.gov or in our vehicle lookup — each complaint carries a checkable ODI number.
About the data
Unit of observation: one vehicle × one component system (n=242), built from NHTSA’s public complaint and recall records for 11 popular vehicles (data through July 14, 2026; independently re-verified July 15, 2026). Recall rate = share of systems in each complaint band with at least one recall; correlation is Spearman’s rank coefficient. Every count can be verified against the records at NHTSA.gov. Definitions and limitations: the methodology section of our flagship study.